MCP Server Health Monitoring and Alerting Patterns
Protocol-aware health checks expose failures that HTTP uptime monitoring cannot detect.
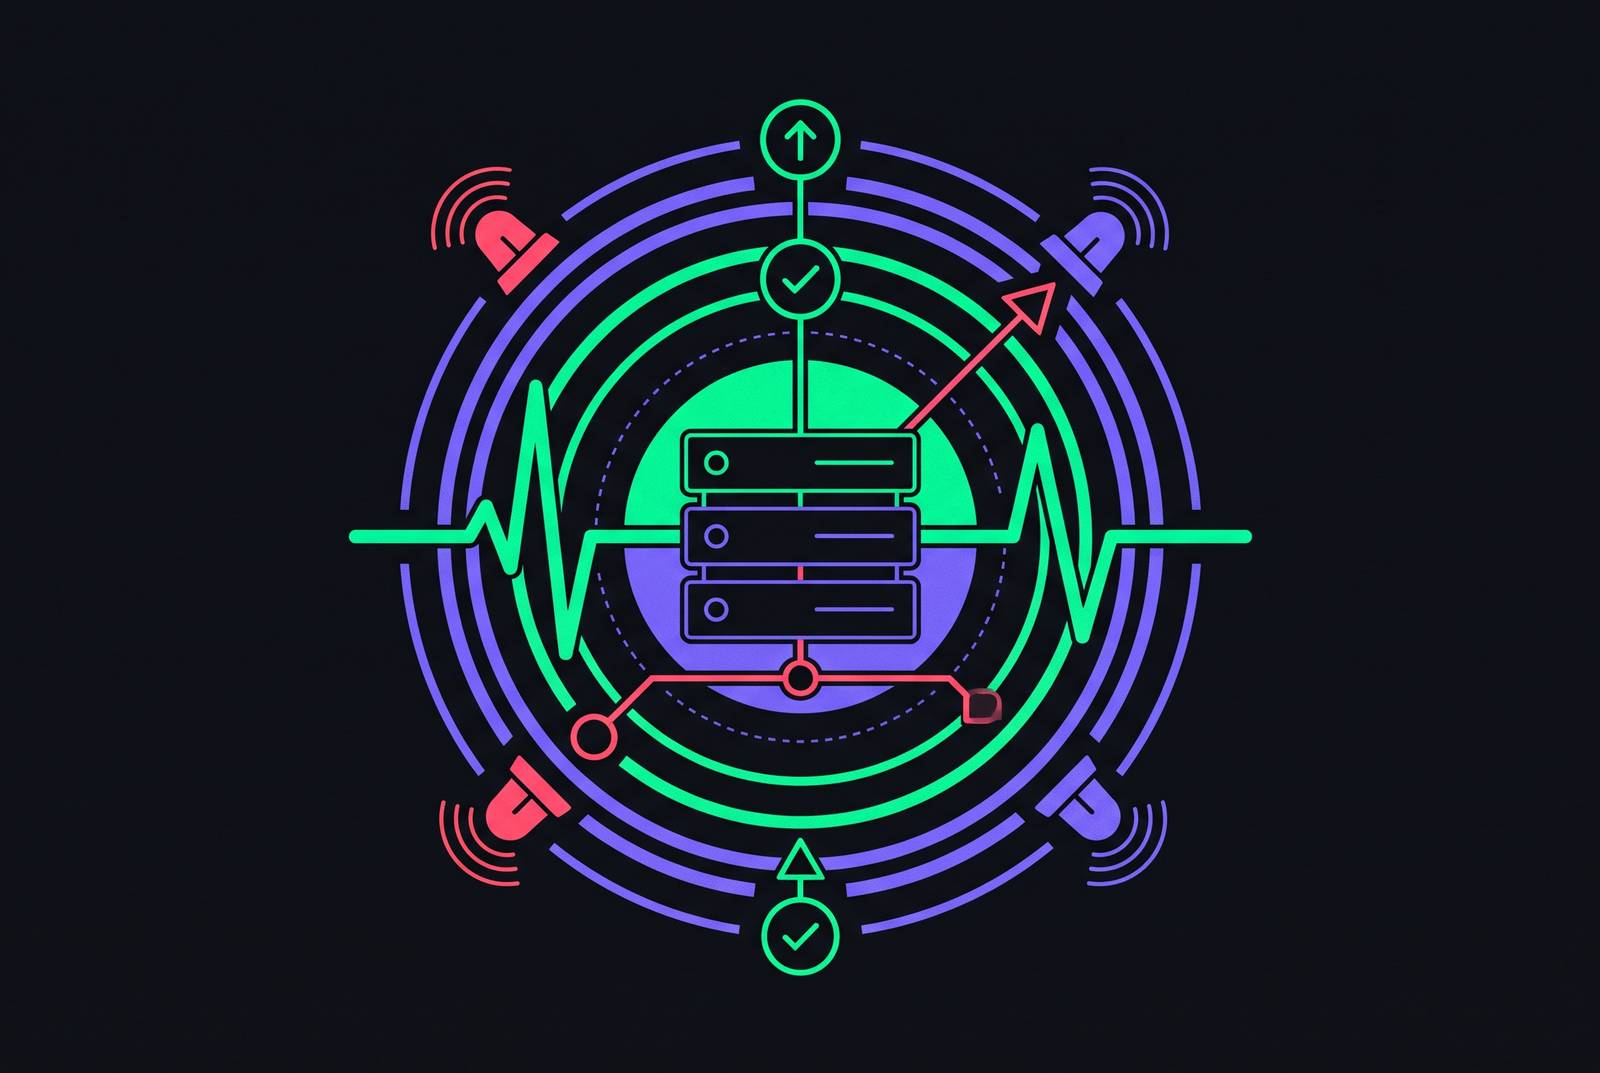
MCP server health monitoring and alerting must test whether agents can use tools. Because MCP combines JSON-RPC 2.0 with stateful sessions and non-deterministic tool execution, production monitoring needs protocol checks, per-tool signals, and traces tied to agent activity. HTTP uptime alone cannot establish health.
Why standard HTTP health checks cannot see the failure modes that break MCP-connected agents
The uptime dashboard is green, but the agent is broken. An MCP server can return HTTP 200 while exposing an empty tools/list, omitting the JSON-RPC request ID, or hanging when a tool runs. The HTTP check records a successful response. It does not establish that the response gives the agent anything it can use.
The mismatch goes deeper than response formatting. MCP adds stateful sessions and tool-call chains that can change between runs of the same prompt. A request passes from host to client to server to downstream API, and a failure at any hop can look like an LLM problem to the user. An empty tool list makes the gap especially clear because nothing appears down, yet the agent has lost access to the tools it needs.
The three distinct transport modes and why each fails differently
The transport determines what a useful monitor must observe. With local STDIO, a process can stay alive and keep its JSON-RPC connection open while tool calls never return. Startup can also fail if a binary is missing from PATH, an environment variable is missing, or initialization takes longer than the default timeout. Codex CLI can silently degrade in these cases, leaving the server’s tools absent. Because a client’s servers share one configuration file, a malformed entry can also break every server.
Remote HTTP+SSE separates network reachability from protocol correctness. A server that can be reached can still return malformed or empty JSON-RPC responses, and upstream API rate limiting can cause tools to fail silently without HTTP errors. OpenStatus sends JSON-RPC ping payloads and checks the full response body to expose that distinction. A successful connection is only the starting point.
WebSocket monitoring has a different blind spot. A long-lived connection can stay open even when its messages are stale, malformed, or incomplete. A sudden drop in average session duration can be a sign of memory leaks, client crashes, or network problems that an open-socket check misses. With all three transports, capability negotiation can also fail when the client and server versions disagree. Monitoring must cover client upgrades because the risk is high while they take place.
What a protocol-aware health check actually tests
Checks start with initialize, then ping, then tools/list. Initialization tests whether the server completes the MCP handshake and returns a valid protocol version. Ping tests whether it processes JSON-RPC messages and echoes the correct id. Tool discovery tests whether the tools agents depend on are present.
Credential handling belongs in this check from the start. Token rotation is the most common source of false alarms in authenticated checks because an expired credential can make a healthy server appear down. When the check sees the unauthorized status, it should send a credential-rotation alert in place of a server-outage alert. OpenStatus recommends a token scoped to read-only health checks, stored outside the repository and rotated on a controlled schedule. Health-check credentials should be kept separate from production credentials.
A ping response must have JSON-RPC version 2.0, an empty result, and a request ID that matches the request. A tools/list assertion must name the expected tools, because a successful response missing a required tool is a deployment regression. OpenStatus’s health check performs initialization, sends notifications/initialized, and runs ping and tool discovery in parallel while reporting per-step latency. Its Healthy, Partial, Auth Required, and Unreachable outcomes distinguish conditions that a binary uptime check collapses into up or down.
The three-layer observability model and why each layer needs its own signals
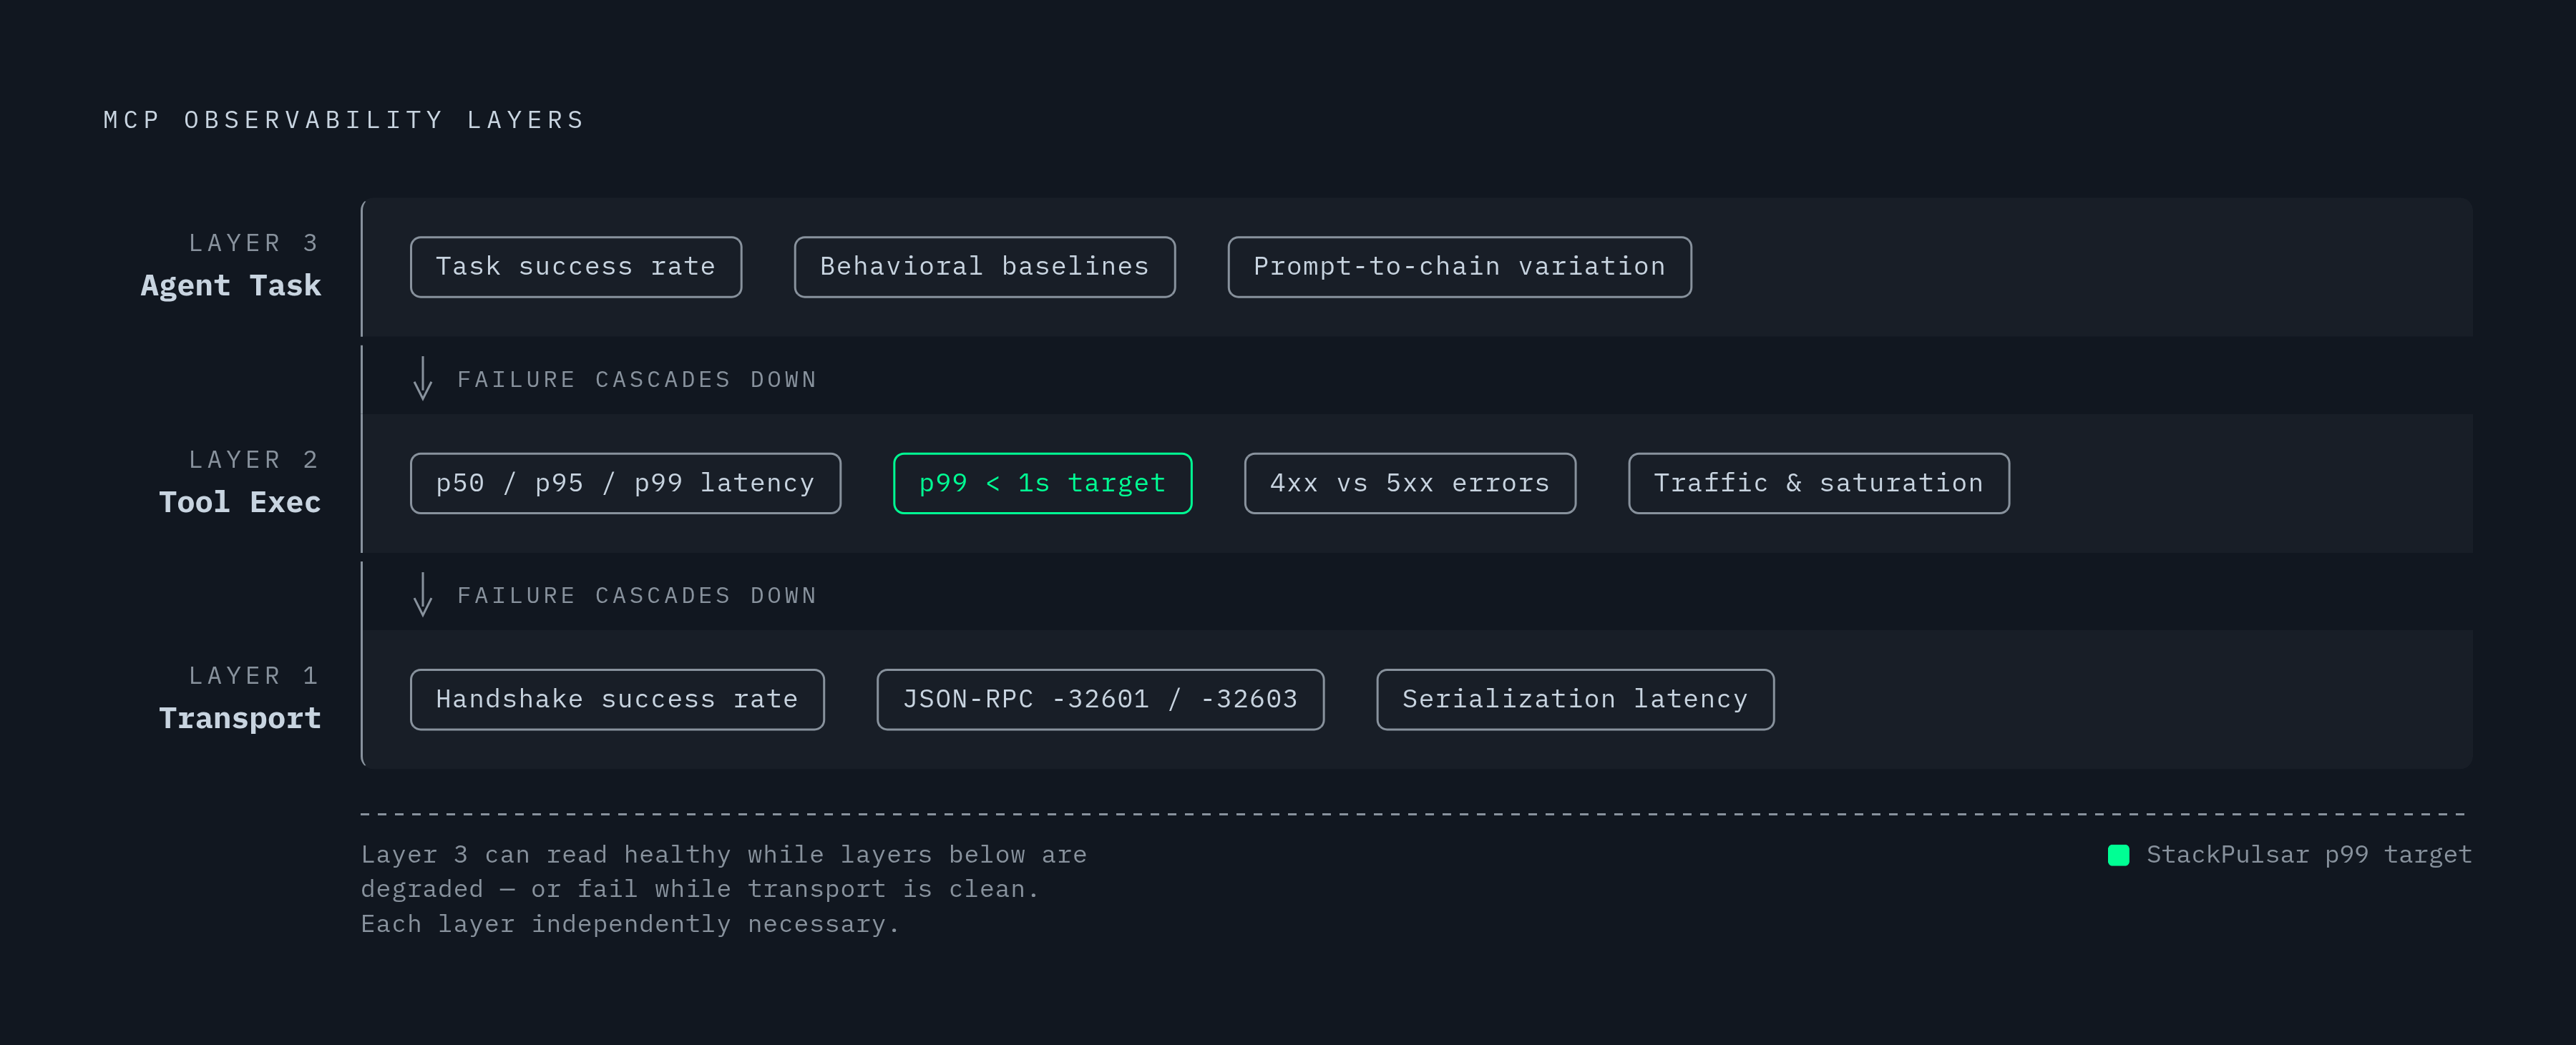
A transport failure does not stay at the transport layer. When a handshake drops, tool execution fails, which causes the agent’s task to fail. Layer 1 therefore needs handshake success rate as a leading indicator, plus JSON-RPC error codes and message serialization latency. A rise in -32601 errors can be a sign of hallucinated tool names, while -32603 points to a server-side bug that needs an alert right away. Serialization latency above target identifies JSON parsing as a bottleneck that higher-level latency metrics cannot isolate.
Layer 2 treats each tool as a microservice. Its Golden Signals are latency, traffic, errors, and saturation, with traffic distribution revealing which heavily used tools become single points of failure. Tracking 4xx errors separately from 5xx errors helps show whether the agent misused a tool, its descriptions were unclear, or its implementation has bugs. Per-tool p50, p95, and p99 latency is more useful than a server average because the agent must wait for a slow tool before continuing its reasoning loop. StackPulsar sets a target of under 1 second for p99 MCP tool-call latency, while token usage per call exposes tools pulling unexpectedly large contexts into the LLM.
Layer 3 asks whether the agent accomplishes its task. Success can stay high when the agent recovers from tool errors, or fall when tools are healthy but the agent’s reasoning fails. Because the same prompt can set off different tool chains, this layer needs behavioral baselines as well as metric thresholds. Correlating all three layers lets operators trace a failed task back through tool execution to the transport or downstream API fault.
Alert thresholds that reflect MCP's protocol behavior, not generic SLOs
A handshake success rate falling below a very high threshold over a short window deserves a Critical alert because handshake drops can precede full outages. OpenStatus uses IAD, AMS, and LAX for its ping monitor, and IAD, AMS, and SIN for tool discovery, with retries to avoid alerting on transient single-check failures. When a check passes in one region but fails elsewhere, routing or CDN trouble is more likely than a server-wide fault.
An error rate that stays above a low threshold over 10 minutes calls for a High alert before the trouble builds up across agent sessions. When an expected tool is missing, it needs its own deployment-regression alert, separate from an alert for an error-rate spike. Concurrent execution approaching capacity warrants a Medium alert because saturation predicts failures before they occur. When task success falls below its defined floor, it calls for a High alert over a longer window to allow for noise in the agent’s non-deterministic behavior.
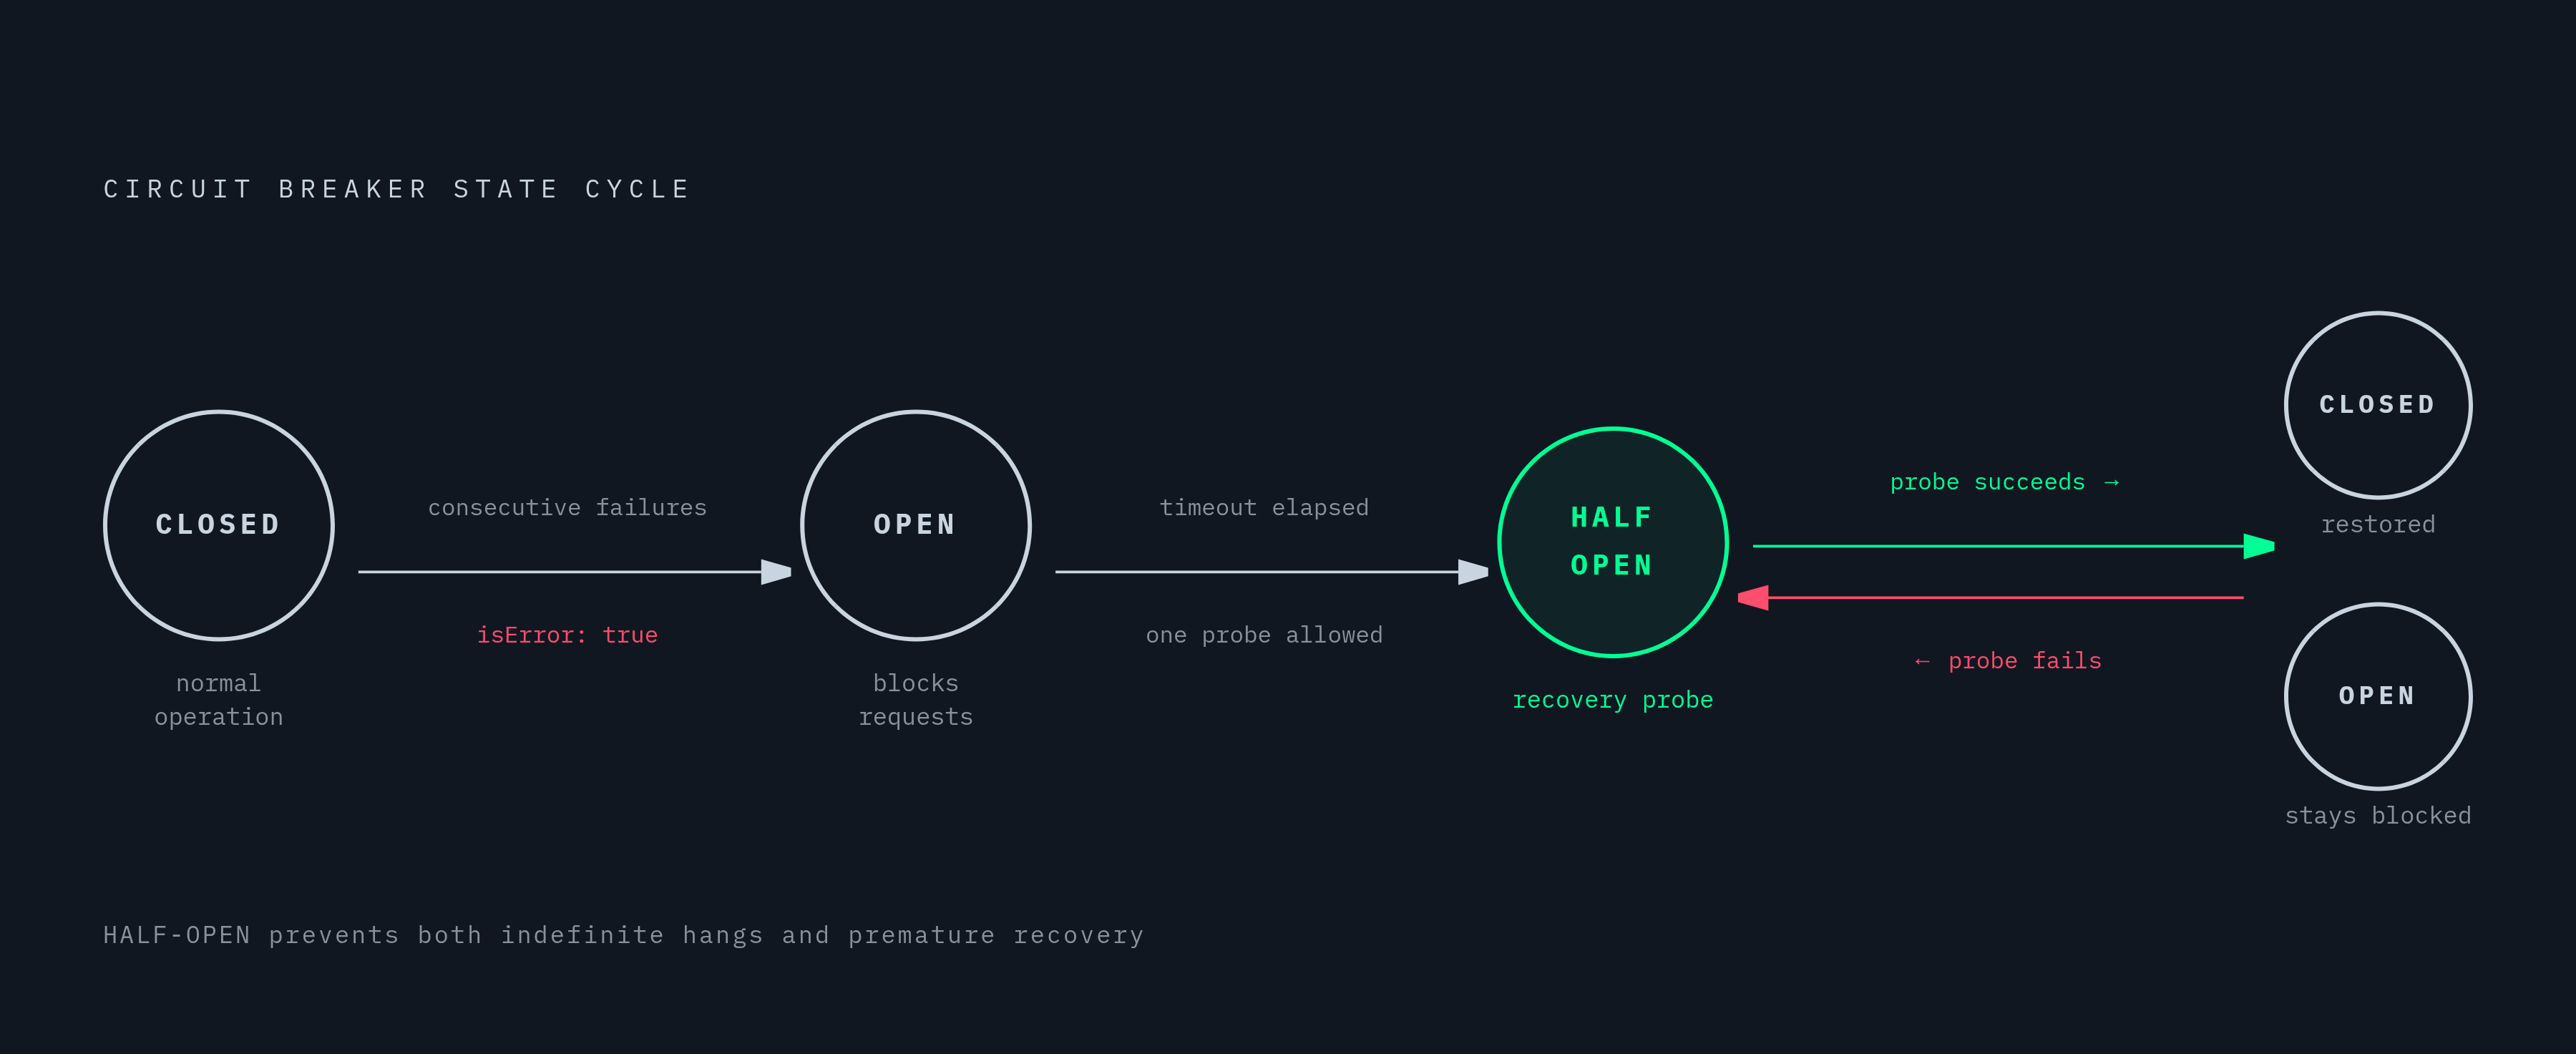
Thresholds can also trigger a response before an operator intervenes. A circuit breaker opens after a configurable number of consecutive failures and returns isError set to true with a descriptive message, avoiding hangs. That gives the agent structured information it can use to route to an alternative tool. The Closed, Open, and Half-Open model allows one recovery probe after a timeout before closing the circuit, avoiding premature recovery and repeated oscillation. At startup, Codex CLI’s required = true setting provides a blunt guardrail by preventing a session from starting without a critical MCP server.
OpenTelemetry instrumentation for end-to-end tracing across the agent-to-tool chain
Those alerts are easier to investigate when traces keep track of the path the request took. Standard APM instrumentation on its own cannot link a tool failure to the agent session and reasoning step that set it off. An application-level hierarchy such as session → task → turn → tool call can provide that context, but it is not an OpenTelemetry requirement. The official OpenTelemetry GenAI semantic conventions define individual MCP client and server request spans, with mcp.session.id as a recommended attribute.
W3C Trace Context fields go into the MCP message’s params._meta property, allowing context to pass from agent to MCP client to MCP server to downstream API without relying on custom headers that might be stripped. Client instrumentation wraps tool calls in spans, records latency and outcomes, and propagates context downstream. It works even when a third party controls the server. Server middleware adds richer internal signals by emitting metrics for every processed request, but requires access to the server codebase.
The backend needs both streams to explain latency. Grafana, Datadog, Honeycomb, or an equivalent system can correlate the slow client call with server processing to show operators where time went. Per-tool instrumentation should emit request count, error count, latency percentiles, and concurrent execution count to feed the alerts above. StackPulsar also recommends monitoring context-size outliers above 50k tokens per request to catch tools pulling unexpectedly large payloads into the LLM.
Security signals that belong in the monitoring layer, not in a separate audit process
The same protocol visibility is a first line of security defense. Tool poisoning places hidden instructions in responses that enter the LLM’s context as trusted input, so payload monitoring should flag content that departs from a tool’s declared schema or expected output structure. Rug pull attacks change tool definitions that were clean while a session is still running. Comparing each tools/list result with a known-good baseline can expose that change. Installation-time approval cannot replace runtime observation.
The Deadbugz campaign illustrates why delayed behavior defeats one-time review. CSA describes a server that behaves as an ordinary text-formatting utility for the first three tool calls and only then rewrites its own tool metadata. CSA also notes that most automated and manual reviews exercise a new integration only once or twice before approval.
Authentication events need equally direct treatment in the monitoring layer. Every successful and failed attempt must record user ID, timestamp, and source IP, with a failure reason when applicable. Repeated failures from one source within a short window should alert the security team. CISA added the LiteLLM MCP authentication bypass, CVE-2026-59822, to its Known Exploited Vulnerabilities list on September 2, 2026, following CVE-2026-42271 in June 2026.
Out-of-range parameters can suggest parameter injection, rapid calls across many resources can resemble scanning, and access to previously untouched resources can suggest lateral movement. A rise in method-not-found errors from one client across many tool names can be a sign that it is probing, rather than that the model is making ordinary mistakes. These patterns belong in security alerts. Enterprise-Managed Authorization, stabilized on June 18, 2026 and adopted by Anthropic, Okta, and Microsoft through Visual Studio Code, governs whether a user can connect a client to a server but does not inspect traffic after token issuance.
How governance and access control integrate with the monitoring layer rather than sitting beside it
A tool-definition change can be a health regression, a security event, and a policy violation at once. Separate systems make that shared event harder to interpret. A unified control layer instead connects protocol observations, security detection, and access decisions through the same record of tool activity. That record must preserve who acted and which server received a request.
SSO and SCIM provision access to MCP servers, but connection-level identity alone cannot explain who invoked a particular tool or what they did. Just-in-time credential issuance scopes access to specific calls, limiting a compromised credential’s reach to a single call. Tool-call policy enforcement provides matching precision. It can block one tool for one user without blocking the entire server.
Thousands of available MCP servers require automated policy enforcement, real-time detection, and centralized audit logs. When security teams can see connections, tool calls, and policy violations together, they can approve new servers with confidence rather than block deployment because agent behavior is opaque. The useful unit of control is the identified tool call, with its protocol outcome, execution trace, and policy decision kept together.