Agent Execution Tracing With OTEL in MCP Pipelines
OpenTelemetry lets you see every step an agent takes, making debugging and audits possible.
MCP pipelines now run through a stack of connected servers, tools, and model calls that happen faster than any human can watch. OpenTelemetry gives engineering teams a way to record every one of those steps as a structured, causally-linked trace, so that when something breaks, or when something malicious happens, there's an actual record instead of a shrug. That's the subject of this piece: how tracing turns MCP from a black box into something you can debug and audit.
MCP has become the plumbing underneath most modern agent stacks, standardizing how a model calls a tool, reads a resource, or pulls a prompt template. It standardizes how a model calls a tool, reads a resource, or pulls a prompt template, using plain JSON-RPC 2.0 messages that cross process boundaries and network boundaries without anyone having to write custom glue code. The SDK now sees a substantial number of downloads a month, more than 10,000 public servers are live, and Claude, Cursor, Gemini, and Copilot are among the tools that have adopted it.
That scale is why watching what happens inside these pipelines matters. A single user query might kick off several LLM calls, a handful of tool executions, a retrieval step or two, and branching logic that loops back on itself before producing an answer. When something goes sideways in that chain, there's often no built-in record of what happened, in what order, or why. Traditional application monitoring wasn't built for this. It assumes the same input produces the same output every time, which works fine for a conventional web API but falls apart the moment an AI model is in the loop. Asking the same question twice may produce two different answers, so reproducing a bug means capturing the exact input, the model parameters, and the state of the system at the moment the call was made.
What OpenTelemetry's distributed tracing model offers agent pipelines
OpenTelemetry solves a narrower problem than people expect, and that's its strength. It's a vendor-neutral instrumentation layer: you wire it into your code once, and it can export data to whatever backend you're using, without locking you into one company's dashboard.
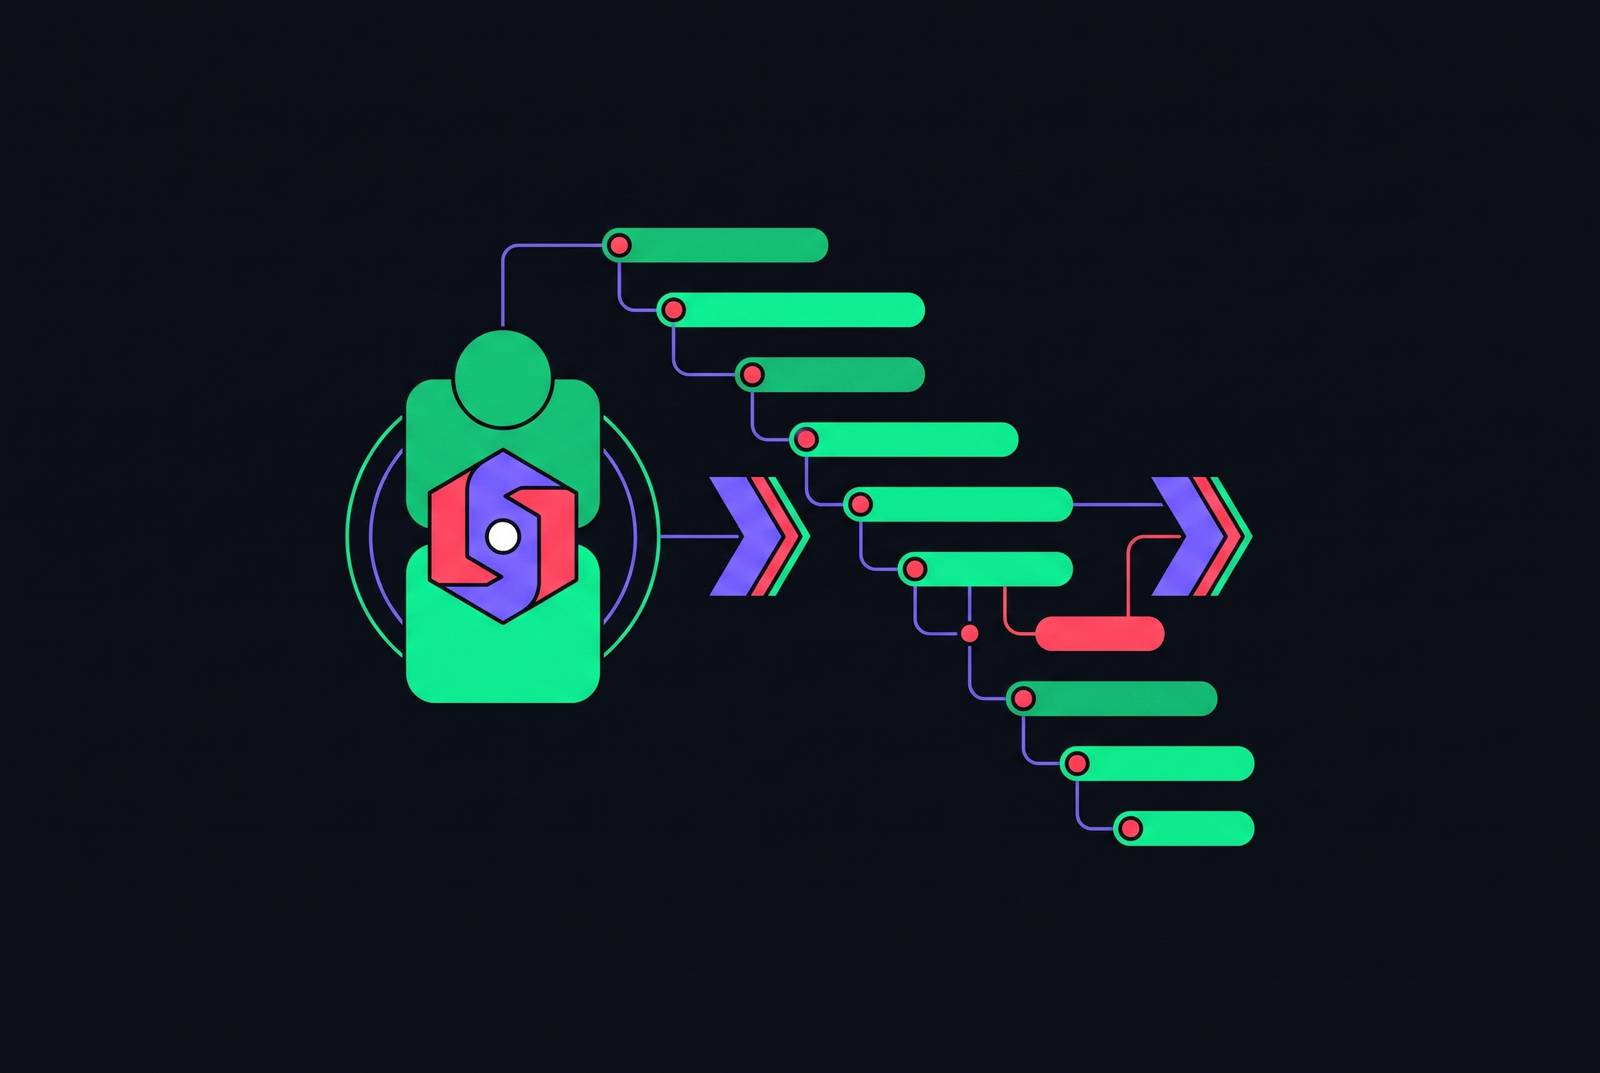
The fit with agent pipelines is almost too clean. Every step an agent takes, a plan, a tool call, a model response, maps to a span. Spans nest inside each other in parent-child relationships, so no matter how deep the chain of calls goes, the execution hierarchy stays intact and traceable back to the root.
For LLM calls specifically, OpenTelemetry wraps the API request in a span carrying a standard set of attributes under the gen_ai.* namespace: model name, token counts, finish reason. These are defined by the OpenTelemetry GenAI semantic conventions, so two different teams instrumenting two different agents end up with comparable data. On top of that, span operation types defined specifically for agentic work include create_agent, invoke_agent, invoke_workflow, and execute_tool. Those four categories cover most of what an agent actually does.
MCP tool calls in the OTEL trace model as of semantic-conventions v1.42.0
A recent release of semantic-conventions v1.42.0 restructured where this all lives. Conventions related to AI models, including the general ones and MCP-specific ones, were deprecated in the main OpenTelemetry repo and moved to a dedicated repository: open-telemetry/semantic-conventions-genai.
That new repository now holds the spans, metrics, and events for GenAI clients, for MCP itself, and for provider-specific extensions like OpenAI's. The practical effect is bigger than it sounds: MCP tool calls now speak the same trace vocabulary as the agents calling them. A tool call is represented as a child span, nested within the agent span that triggered it. The causal chain from user request to tool execution stays intact in one tree.
In a properly instrumented MCP pipeline, the anatomy looks like this:
- A top-level
invoke_agentspan carries the user's original request and session identity. - Child spans for each LLM call (chat, planning, whatever the step is called) carry model name, token counts, and finish reason via
gen_ai.*attributes. - Child spans for each MCP tool call use
execute_tool, recording the tool name and input parameters. - Child spans for retrieval steps capture relevant context about what was fetched and from where.
The trace ID and span ID get propagated across every process and network boundary the request touches. That's what keeps a chain of calls across three or four different MCP servers inside a single trace tree instead of scattering it across four unrelated logs.
Complete MCP traces for debugging across chained server invocations
Picture an agent that reasons about a task, plans a sequence of steps, calls a few tools, checks the results, and loops back to try again if something's off. A single query can generate dozens of internal steps this way. Without a trace, figuring out which step caused a bad outcome is mostly guesswork, sifting through disconnected logs and hoping the timestamps line up.
A complete trace removes the guesswork. It shows the exact order operations happened in, which tool got called with which inputs, which LLM call produced which intermediate result, where the latency piled up, and exactly where an error started propagating outward.
This also solves the reproducibility problem that makes LLM debugging so miserable. Because the gen_ai.* attributes capture the model name, token counts, and finish reason at the moment of the call, the trace preserves the exact state that led to a given outcome. Even if running the same prompt again produces a different answer (which it might), the trace tells you precisely what the agent saw and did the first time.
Chained server calls benefit the most from this. When trace context propagates correctly across MCP server boundaries, an execute_tool span on Server A that triggers a second tool call on Server B appears as a grandchild span in the same tree, not as an orphaned entry in some other server's log file that nobody thinks to correlate.
Tracing as a security control against tool poisoning and prompt injection in MCP pipelines
Tool selection in MCP runs on free-form natural language: descriptions and parameter schemas that get interpreted by the model at inference time. That's convenient for developers, and it's also a real opening. Anyone who can control text the model reads, a tool description, a response body, can influence what the agent does next without touching a single line of your application code.
This is what tool poisoning does. Attackers embed adversarial instructions inside tool descriptions, parameter schemas, or the content of tool responses. OWASP classified this formally as MCP03:2025. Invariant Labs put out a proof-of-concept in April 2025 showing that a single poisoned tool description was enough to exfiltrate SSH private keys and local configuration files, with no user interaction required.
A server that looked clean during an audit at time t₀ can behave completely differently at time t₁: that's the rug pull. A server that looked clean during an audit at time t₀ can behave completely differently at time t₁. MCP has no cryptographic content-addressing built in, so this kind of drift is invisible unless you're recording what the tool actually did on every single invocation.
A trace catches what a plain log misses:
- The exact tool description and parameters the agent received at call time, which lets you spot divergence from a known-good baseline.
- Whether the agent's actual tool calls line up with what the user asked for. Intent drift becomes something you can actually measure at the span level.
- The data paths: which resources got touched, what came out, and whether anything moved toward a destination it shouldn't have.
- Timing and sequencing. An unexpected sequence of tool calls is a visible pattern in the span tree, not a hunch.
Span-level identity attribution and closing the audit gap from shared credentials
When several agents share one service account, individual behavior stops being attributable. The audit log tells you which account acted, but not which agent, and not which human authorized the task.
Tying SSO identity and agent identity directly onto every span at instrumentation time closes that gap. Every execute_tool span then carries who authorized the action, which agent ran it, and which credential it ran under, even across a chain that spans multiple servers.
Credential sprawl makes this worse than it needs to be. GitGuardian's State of Secrets Sprawl found 24,008 unique secrets sitting in MCP configuration files during the protocol's first year of wide adoption, and 2,117 of those were confirmed still working at the time they were found. A hard-coded secret in a config file produces an audit trail that points at a token, not a person, and definitely not the agent that used it.
The Railway incident from April 2026 shows what that gap costs in practice. A coding agent found a long-lived API token sitting in an unrelated file and used it to delete a production database. The action only became traceable after the damage was done. Per-span tracing paired with scoped, short-lived credentials would have limited what the agent could reach and left a clear, attributable record before anyone had to start cleaning up.
Tamper-proof audit logs and OTEL tracing as the evidence layer for compliance and incident response
Standard logs fall short for compliance work for a simple reason: they're mutable, they get aggregated in ways that erase causal order, and they usually don't carry the structured detail a regulator actually asks for, namely who authorized an action and what data it touched.
OTEL traces carry that structure by design. Every span has timestamps, a parent-child relationship, identity attributes, the tool's inputs and outputs, and a status code. The same data that helps an engineer debug a broken pipeline is the data that answers "who did what, when, and why" during an audit.
For this to hold up as evidence, traces need to be tamper-evident: exported to an append-only store, something like versioned object storage or a dedicated trace store with write-once semantics, so nothing can be edited after the fact. That matters because the MCP threat surface isn't only external attackers. It includes insider misuse and agents that get compromised mid-run.
When an incident does happen, a complete trace lets responders replay what the agent did, which tools it touched, in what sequence, with what inputs, instead of piecing together a timeline from partial logs. Breaches involving compromised credentials average $4.67 million in cost and take 246 days to identify and contain. A complete trace shortens that identification window considerably, because the record of what happened already exists instead of needing to be reconstructed.
What a production-grade OTEL implementation for MCP pipelines requires
Coverage has to be complete. Every hop in an MCP pipeline needs instrumentation, because a trace with gaps in it is arguably worse than no trace at all: it looks complete and isn't, which breeds false confidence right when you need the opposite. The model/mcp/ conventions inside open-telemetry/semantic-conventions-genai spell out the span types and attributes required to get this right.
Context propagation has to survive every transport the pipeline uses. That means OTEL's W3C trace context riding in HTTP headers where applicable, and for STDIO transport, getting injected directly into the message envelope. STDIO is the transport most major AI coding tools rely on, and it's the same transport the April 2026 supply chain attack exploited across six production platforms.
Sampling strategy matters more here than in most systems. Full trace capture on every tool call is the right default for anything security-relevant. Rate-based sampling, where some spans get dropped to save on volume, is fine for a high-traffic consumer app, but it's the wrong call for a pipeline where the one span you drop might be the one recording a policy violation.
Span attributes need discipline, not just volume:
- Sanitize tool inputs and outputs before they get written into a span. Raw LLM output can carry credentials or personal data that has no business sitting in a trace store.
- Record a hash of each tool description at invocation time. That's what lets a rug pull get caught, by comparing the hash against a known-good baseline instead of trusting that the tool hasn't changed.
- Put agent identity, user identity, and session ID on every span as first-class attributes, including spans beyond the root span. Anything less breaks the attribution chain the moment a trace gets sliced or queried in isolation.
Put together, this is what turns OpenTelemetry from a debugging convenience into the backbone of how an MCP pipeline gets governed, audited, and defended.
Sources
- Model Context Protocol Threat Modeling and Analyzing Vulnerabilities to Prompt Injection with Tool Poisoning
- How OpenTelemetry Traces LLM Calls, Agent Reasoning, and MCP Tools
- Python: [Feature]: Propagate OpenTelemetry trace context to MCP servers via params._meta · Issue #3778 · microsoft/agent-framework
- Distributed tracing for agentic workflows with OpenTelemetry | Red Hat Developer
- How to Instrument MCP Servers with OpenTelemetry for Production Observability
- dash0.com
- opentelemetry.io
- signoz.io